Think of the Dashboard as Mission Control for your threat services. It provides a dynamic overview of your test results, intelligence insights, projects, and issues in one centralised interface. Here you’ll find a live feed of issues identified by your security consultant in real time, helping you remediate issues faster than ever before.
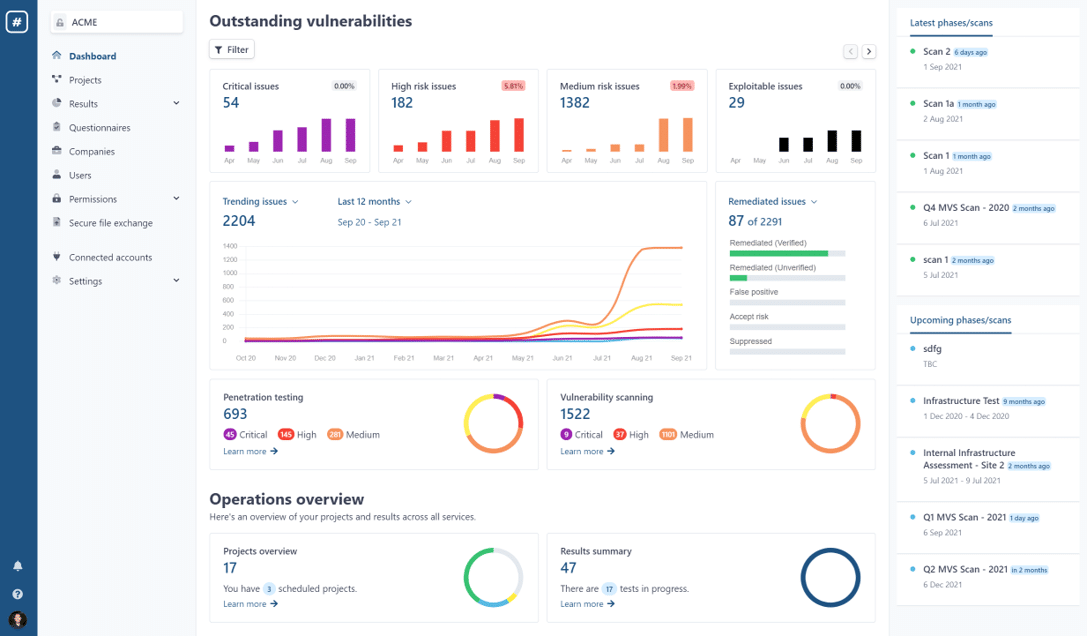
As you scroll down the Dashboard, you’ll see the following:
- Outstanding Vulnerabilities
- Outstanding Vulnerabilities Graph (including remediated and outstanding Issues)
- Operations Overview
- Latest Test (‘Upcoming phases’) and MVS Scans (‘Latest/Upcoming scans’)
- Issues Breakdown
- Assigned To Me
Read on to find out more about these sections.
Outstanding Vulnerabilities
At the top of your Dashboard, the bar charts give you a summary of outstanding vulnerabilities from your tests across your service lines (e.g. both penetration testing and vulnerability scanning), categorised by severity.
Click on the left and right arrows on the right-hand side to scroll through all of your charts.
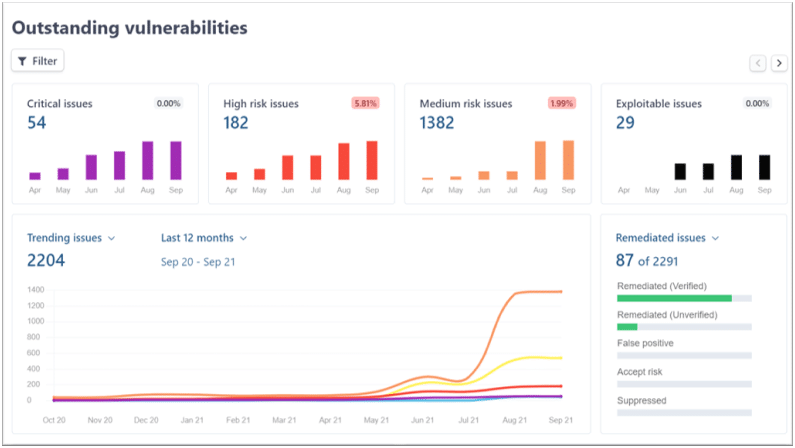
You can also see how many of these issues have known exploits in the Exploitable Issues chart.
The percentages in the top right-hand corners of the bar charts indicate the percentage increase or decrease of these issues on a monthly basis.
Outstanding Vulnerabilities Graph
You can view trending data of your outstanding vulnerabilities by viewing your Outstanding Vulnerabilities Graph.
The graph shows a breakdown of all open issues found each month, across all service lines, categorised by risk level.
The colours categorise the vulnerabilities by risk level: Critical (Purple); High (Red); Medium (Orange); Low (Yellow), and Blue (Info).
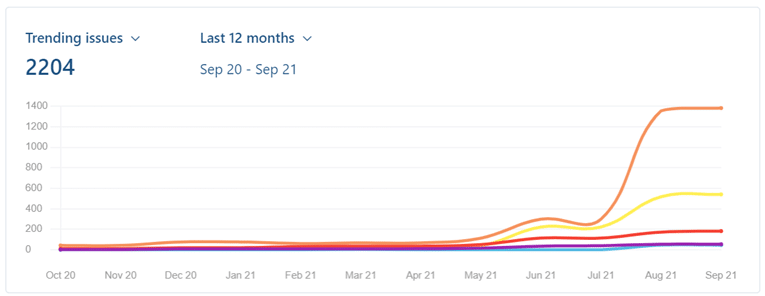
You are able to adjust the date range to show outstanding vulnerabilities for the last three, six, or twelve months.
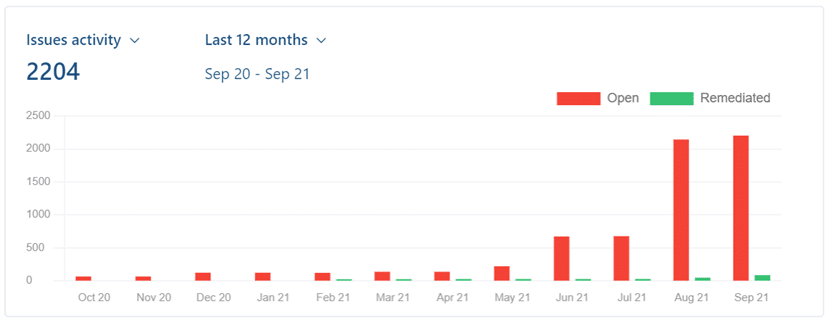
You can also switch the graph to an Issues Activity view by selecting Trending Issues in the top-left corner. This will detail the rate at which you are remediating issues versus outstanding issues on a month-by-month basis.
To the right of the graph, you can see a summary of how many vulnerabilities you have remediated versus the different issue statuses available within Rootshell.
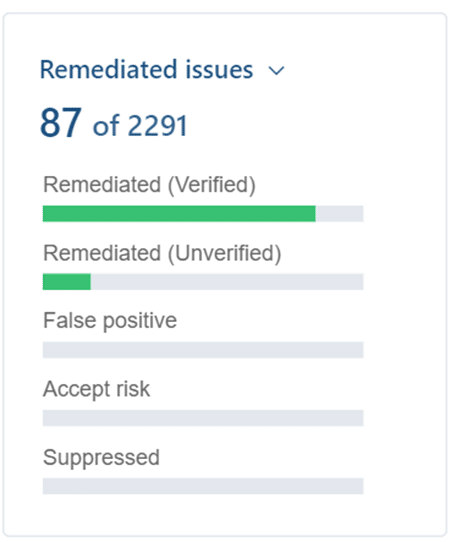
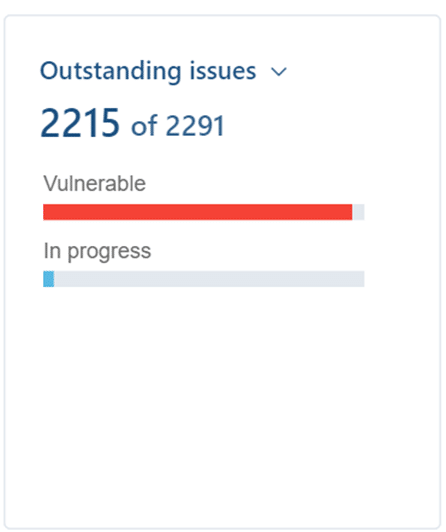
Again, this view can be switched to an Outstanding Issues view, where you can see those issues that are in progress for remediation.
Below the graph, you can see a breakdown of your issues by service line.

Operations Overview
Here, you can see a summary of ongoing and completed projects (a project represents a scope of work, for example an annual penetration test), and how many results have been produced by completed and ongoing tests.

Click ‘Learn More’ under either the Projects Overview or Results Summary for more details.
Issues Breakdown
This section of the Dashboard shows you a live feed of issues, which are uploaded by your consultant in real-time.
You will receive an email alert if your consultant uploads an issue with a ‘Critical’ or ‘High’ risk level. Manage your Email Notifications by selecting your profile icon in the bottom left-hand corner; check which alerts are turned on under Notifications.
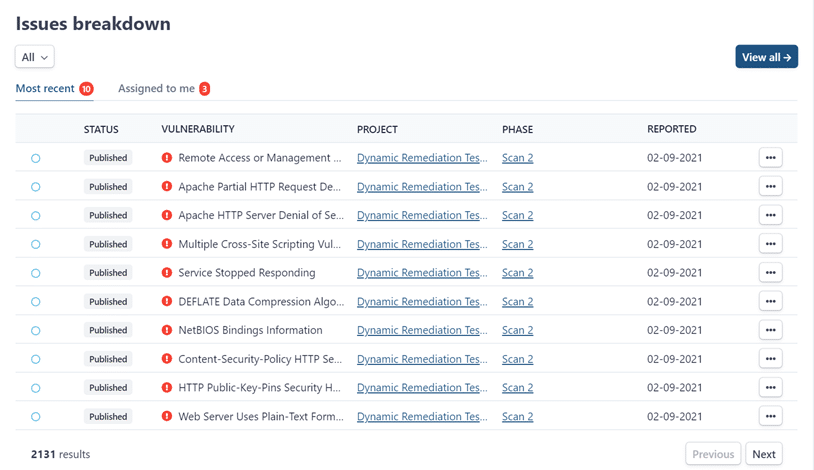
The feed is organised into four columns:
- Status: whether your issue has been published or not.
- Vulnerability: displays the name of the issue and its associated severity.
- Project: identifies which Project the issue relates to.
- Phase: identifies which test the issue has been identified from, e.g. ‘Website Application’.
- Reported: The date the issue has been reported.
Click the three–dots menu on the right-hand side of each issue and select ‘View Issue’ to see all details for it.
Select the ‘Assigned to me’ tab to view the issues that have been assigned to you from within the platform.
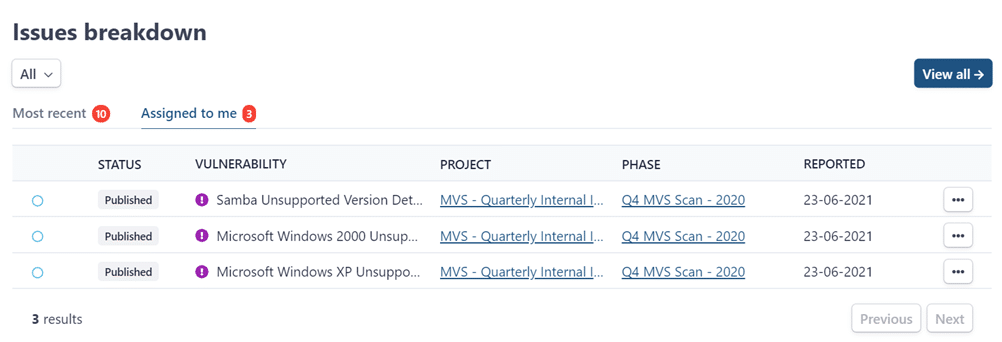
The same issue information is available.
Subscribe So You Never Miss an Update


